More on MIDRC data representativeness.
Last updated January 23, 2024
There currently are 2 seminars specific to measuring MIDRC data representativeness and associated tools on the MIDRC YouTube channel.
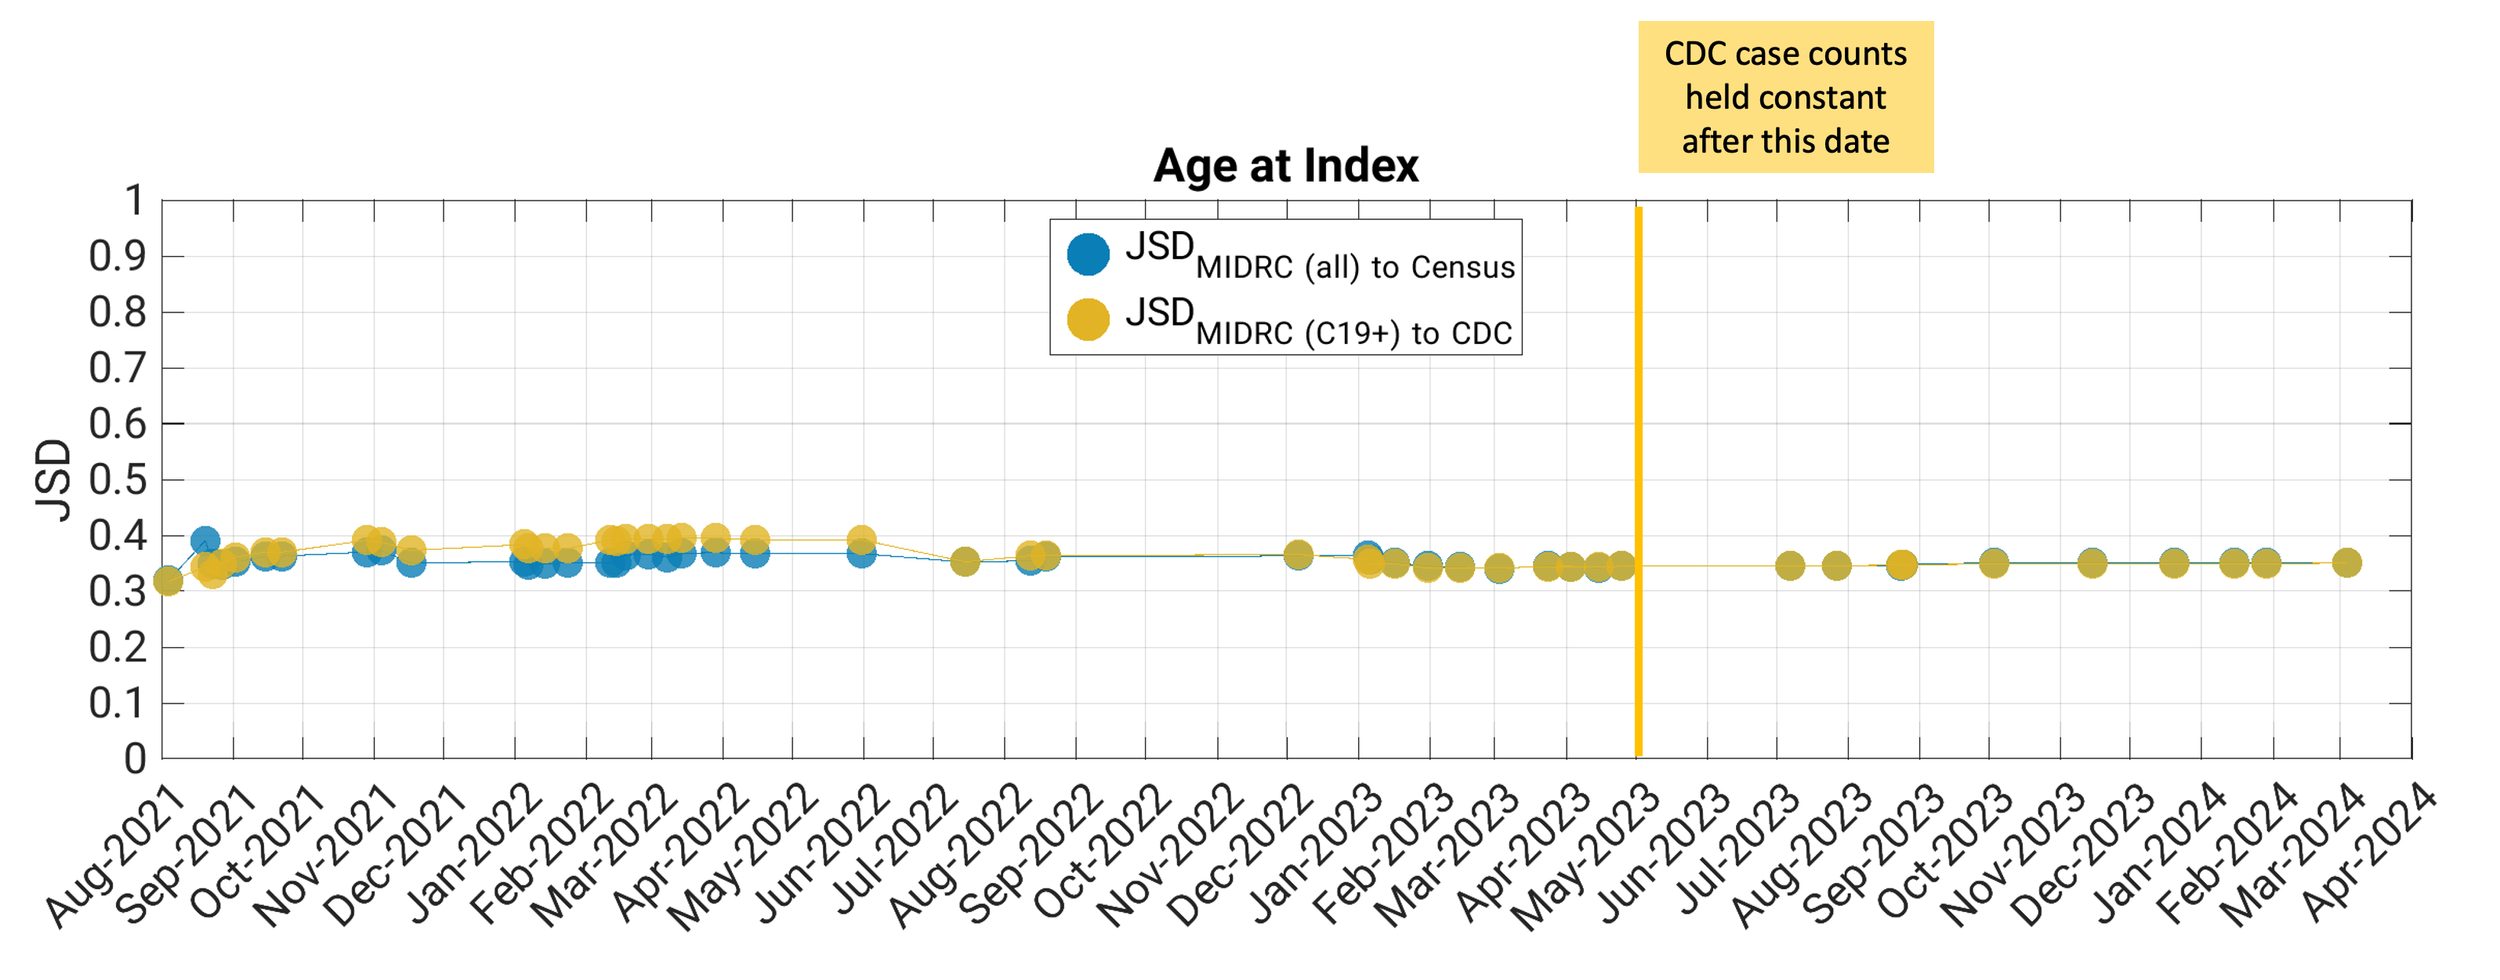
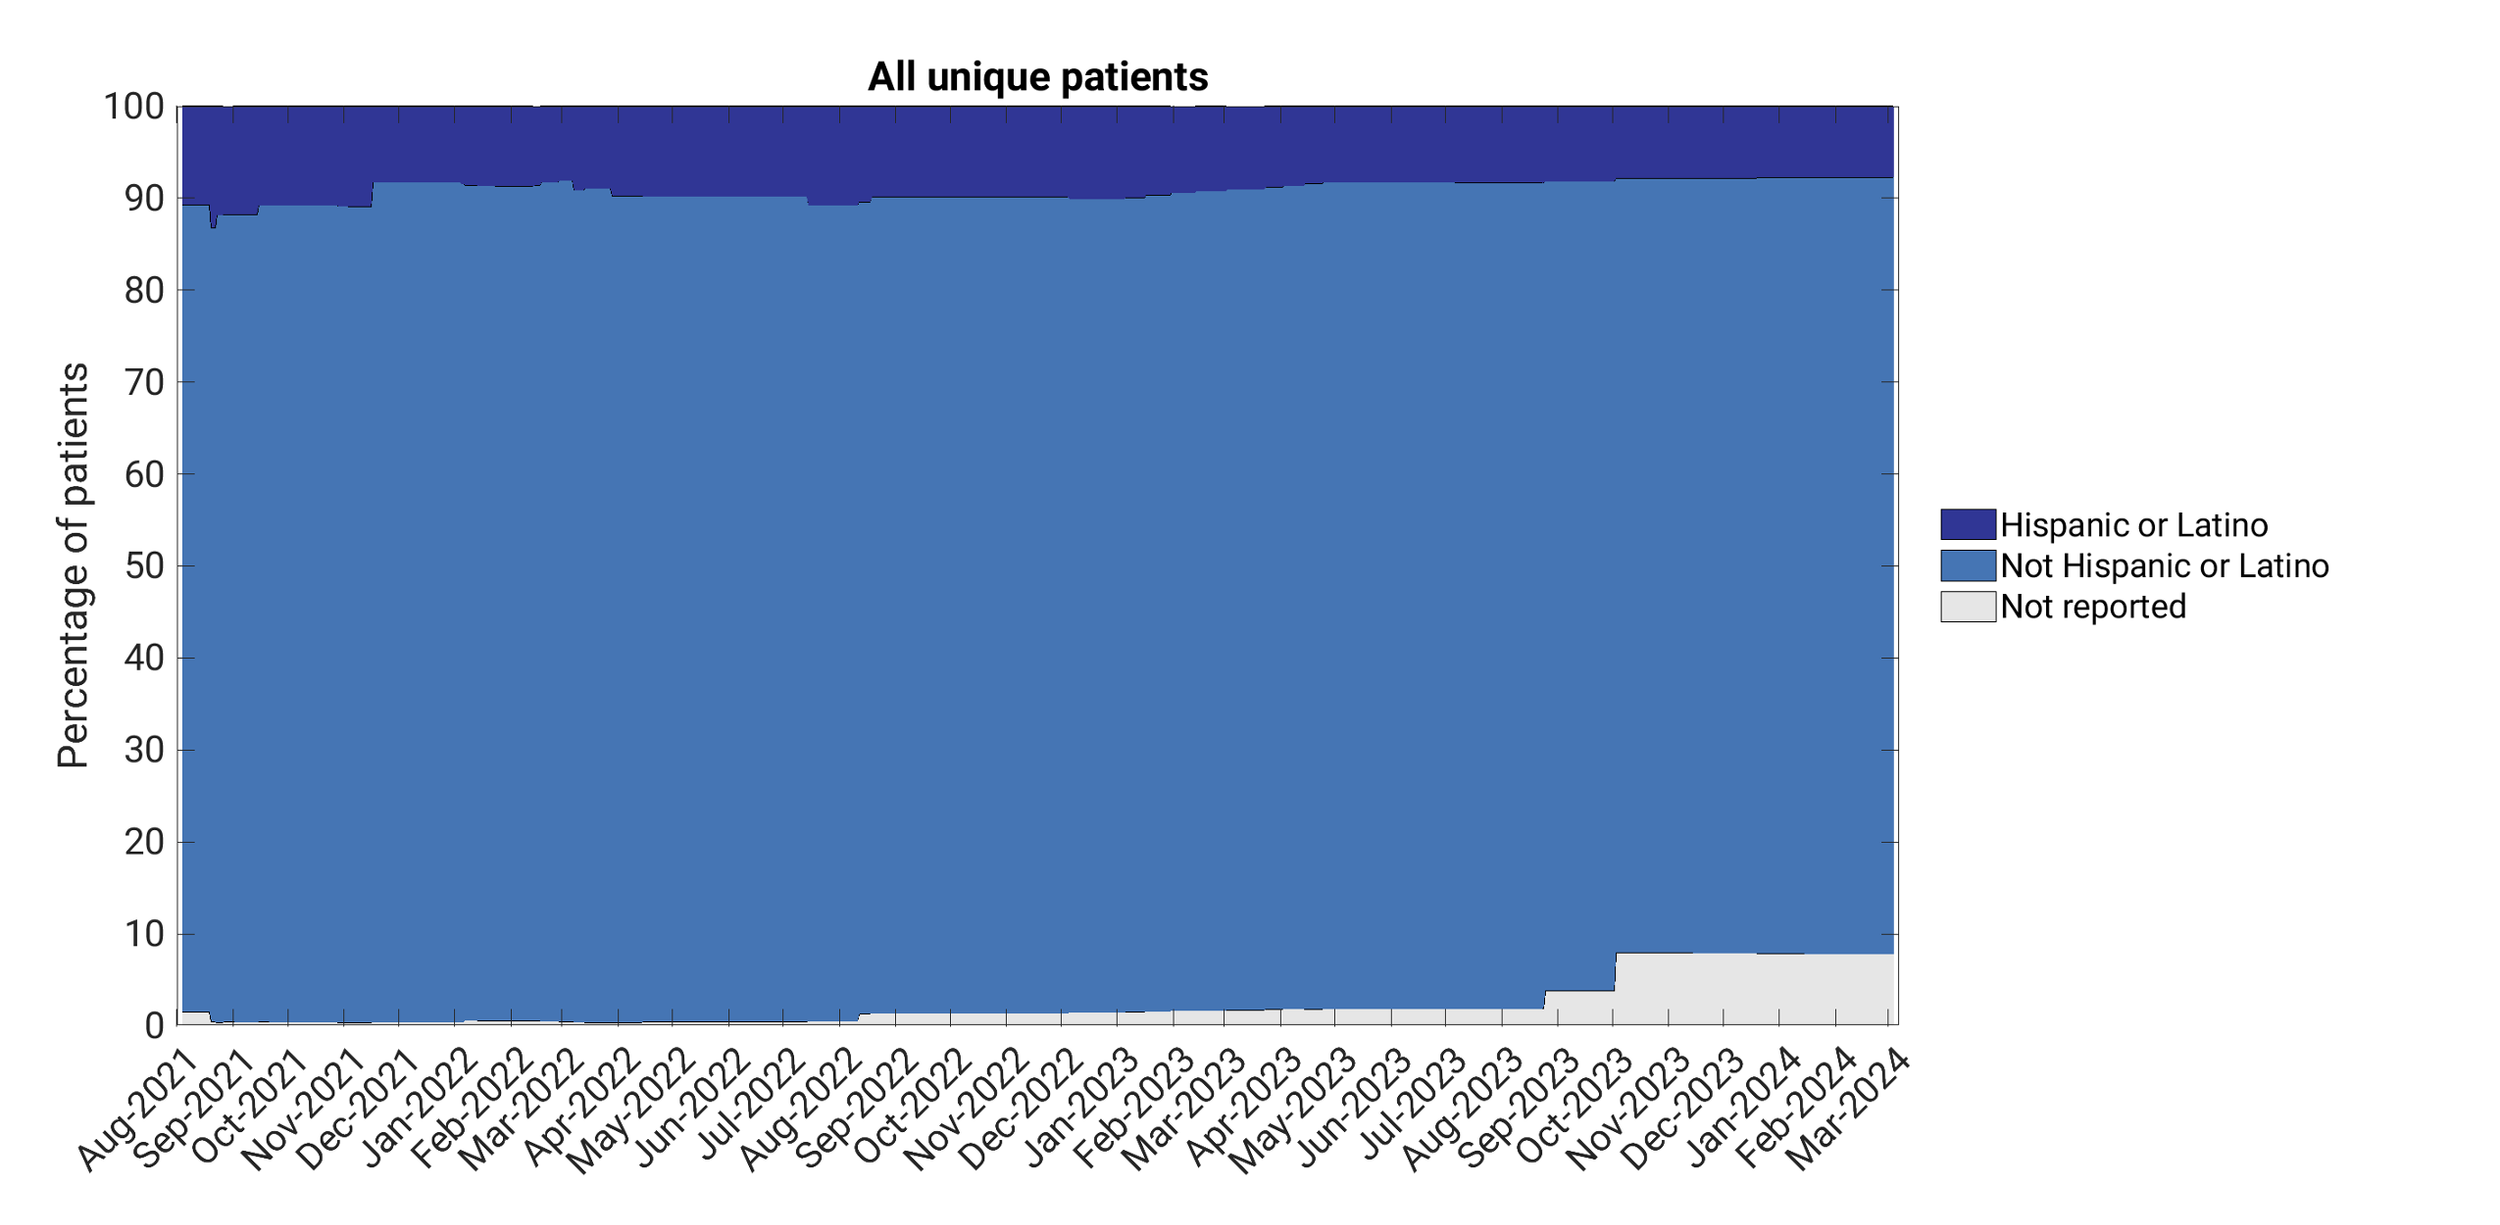
Below are snapshots of MIDRC data: number of cases and data representativeness in terms of demographics as well as longitudinal data (changes over time). The JSD, i.e., the Jensen-Shannon divergence, is a is a method of measuring the similarity between two probability distributions. A JSD of zero indicates ‘perfect’ similarity’, while a JSD of 1 indicates the lowest possible similarity. Our free open-source MIDRC-REACT (representativeness exploration and comparison tool) is available for download!